Your Client Base Has a Cost
What client relationship decisions are doing to your financial structure right now

When clients disengage, the Selling Costs filter feels it first through a rising CAC (Customer Acquisition Cost). When scope creep goes unmanaged, the Operating Costs filter absorbs it silently. This issue traces exactly how client relationship decisions move through the four economic filters and what to measure before the damage reaches the numbers.
Every business has a financial architecture. Revenue comes in, passes through the four economic filters, and what survives becomes profit. That is the mechanical sequence. But the sequence only works as designed when the revenue entering it is stable, growing, and margin-efficient.
When the client base is deteriorating quietly underneath the surface, the financial architecture does not break all at once. It erodes. Filter by filter. Dimension by dimension. Often slowly enough that the founder does not connect the two until the damage is already done.
This is the connection most founders miss. Client Success and the Financial Operating System are not two separate systems running in parallel. Every decision made inside your client relationships is simultaneously a financial decision. It just does not always show up that way in the numbers until it is too late to treat it cheaply.
WHEN A CLIENT DISENGAGES, WHICH FILTER FEELS IT FIRST
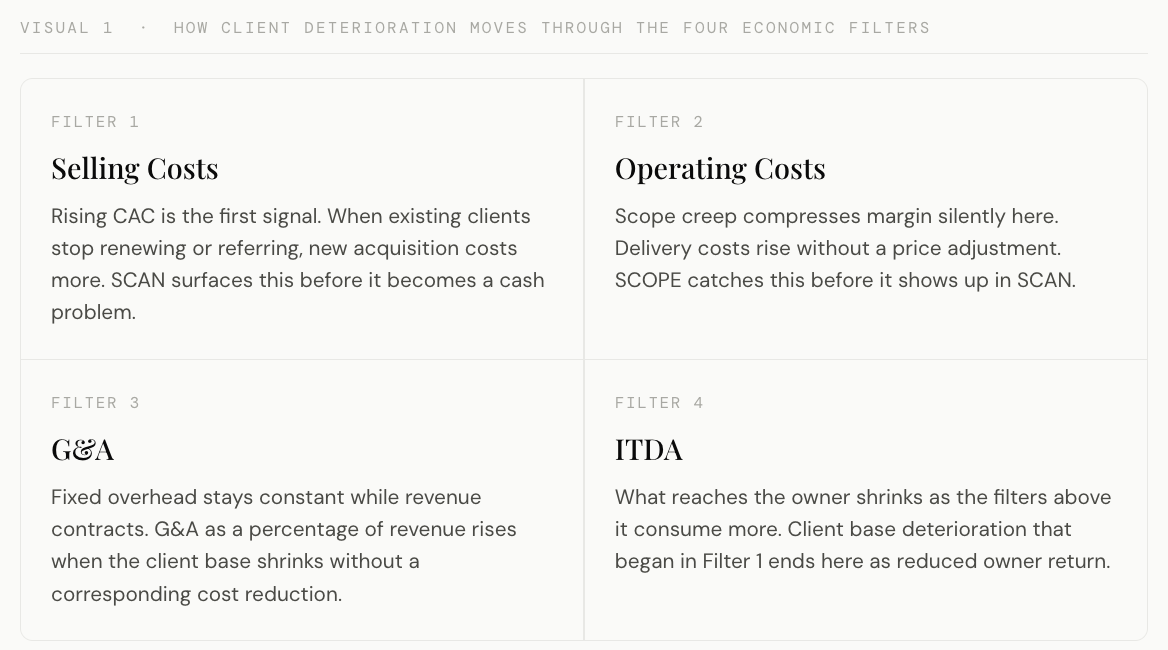 The Selling Costs filter is where client deterioration almost always appears first. Not because marketing spending increased, but because CAC (Customer Acquisition Cost) went up.
When existing clients stop renewing, stop expanding, or stop referring, the business has to work harder to replace that revenue from new acquisition. More outreach. More sales effort. More time converting prospects who do not already know the business. All of that has a cost. That cost sits in Filter 1. And when SCAN (Structural Cost Analysis by Net-profit Filter) runs across the four economic filters looking for where margin is leaking, a rising CAC (Customer Acquisition Cost) against flat or declining revenue is one of the clearest signals that the client pillar underneath is not holding.
The founders who catch this early tend to see it in their SCAN output before they feel it in their revenue. The ones who catch it late feel it in their cash position first and then spend months trying to reverse a trend that has been building for quarters.
WHAT AVERAGE MRR ACTUALLY REVEALS
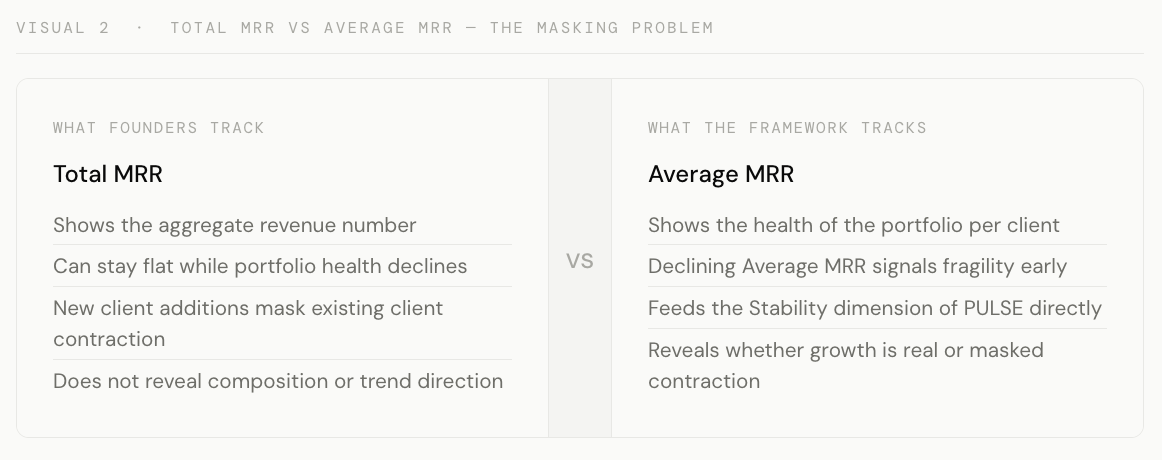 Average MRR (Monthly Recurring Revenue) is the number most founders either do not track or track incorrectly. Total MRR is what most founders look at. Average MRR across the active client base is what tells the real story.
A business can hold its total MRR flat while its Average MRR declines. This happens when new clients are being added at smaller contract sizes while existing clients contract or churn quietly at the back. The aggregate number looks stable. The underlying portfolio is deteriorating. And the Operating Costs filter, which is sized to deliver at a certain revenue level and margin assumption, is now working harder per dollar of revenue than it was designed to.
Revenue quality is not just whether revenue is growing. It is whether the composition of that revenue is getting healthier or more fragile over time.
This is the masking problem. It is also why PULSE (Profit, Utilization, Liquidity, Stability and Earnings), the instrument that measures financial health across five dimensions every month, has a Stability dimension specifically designed to read this.
THE OPERATING COSTS PROBLEM THAT STARTS WITH SCOPE
The second filter that client relationship decisions affect directly is Operating Costs. This is where SCOPE (Service Commitment and Output Performance Evidence) becomes a financial instrument and not just a delivery management tool.
When scope creep goes untracked, the business delivers more than it committed to without adjusting the price. That additional delivery has a cost. Direct labor. Additional time. Resources that were not priced into the original engagement. Those costs sit in Filter 2. And because they were never captured as scope changes, they do not appear in any client-level profitability analysis. They simply compress the margin on that engagement silently.
Run SCAN across a portfolio of engagements with unmanaged scope creep and you will almost always find that the Operating Costs filter is consuming a higher percentage of revenue than the IPT (Inverted Profit Triangle) model allows. The profit target was set correctly. The cost structure was designed correctly. The delivery commitments were not managed correctly, and that gap between what was committed and what was delivered is where the margin went.
THE STABILITY DIMENSION AND WHAT IT IS ACTUALLY READING
PULSE (Profit, Utilization, Liquidity, Stability and Earnings) measures five dimensions of financial health every month. The Stability dimension is the one most directly connected to the client pillar, and it is the one most founders interpret too narrowly.
Stability in PULSE is not just about whether revenue is recurring. It is about whether that recurring revenue is diversified, defended, and trending in the right direction. A business where one client represents thirty percent of total revenue has a Stability problem regardless of what the total revenue number looks like. A business where Average MRR has been declining for three consecutive months has a Stability problem that will show up in cash runway within two quarters if the trend holds.
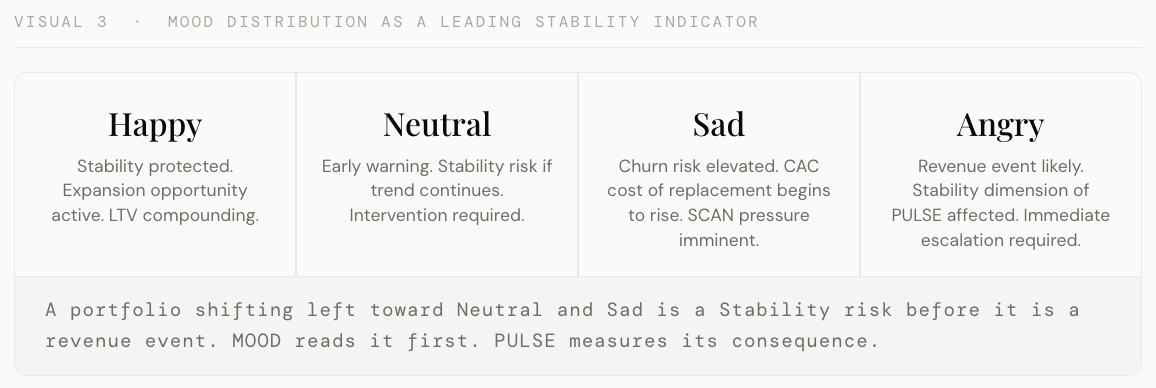
The MOOD (Managed Outcomes Of Delivery) distribution across the client base is what feeds this dimension with the most forward-looking signal. A portfolio moving toward more Neutral and Sad clients and away from Happy ones is a Stability risk before it is a revenue event. MOOD reads it first. PULSE measures its financial consequence. And the founder who is watching both has time to act.
 ---
---
THE DECISION THE FINANCIAL OPERATING SYSTEM CANNOT MAKE ALONE
SCAN (Structural Cost Analysis by Net-profit Filter) can locate where margin is leaking. PULSE (Profit, Utilization, Liquidity, Stability and Earnings) can measure the financial consequence of client base deterioration. ARCH (Allocation, Resource and Cost Hierarchy) can rebuild the cost structure once the leak is identified. But none of the Financial Operating System instruments can tell you which specific client relationship is driving the problem, why it is happening, or what the correct intervention is.
That is what HEART (Holistic Engagement and Account Relationship Tracking), PATH (Phased Approach to Happiness), SCOPE (Service Commitment and Output Performance Evidence), and MOOD (Managed Outcomes Of Delivery) are built to do. They read the signals before the numbers move. They name the client. They classify the state. They prescribe the response. And when their output is read alongside the Financial Operating System instruments, the founder has something neither system can produce alone: the ability to act on a revenue risk before it becomes a financial event, with enough precision to know exactly where to act and what to do.
This is what the Alt Business Performance Framework means when it describes Client Success and the Financial Operating System as connected rather than parallel. They share the same data. They inform the same decisions. And the founder who runs them separately is always working with half the picture.
ONE NUMBER TO FIND BEFORE THURSDAY IS OVER
Pull your Operating Costs as a percentage of revenue for the last three months. Then pull it for the same three months in the prior year.
If Operating Costs as a percentage of revenue have increased without a corresponding increase in pricing or a deliberate investment in delivery capacity, scope creep is likely the cause. And scope creep is always a client management problem before it is a financial one.
That is where to start.
Monday: PATH. The instrument that has to be built before any other instrument in this pillar can work. What the client journey looks like when it is designed rather than experienced.